Nutritional Composition of British Pub Meals
Understanding the energy density and macronutrient profiles of traditional pub classics.
Understanding the energy density and macronutrient profiles of traditional pub classics.
Energy density refers to the number of kilocalories contained in a given weight of food. Traditional British pub meals, characterised by generous portions, deep-frying techniques, and rich sauces, typically exhibit high energy density. This section explores the fundamental concepts behind why certain preparations result in greater caloric concentration.
The preparation methods commonly employed in pub kitchens—such as deep frying in oil, incorporation of pastry, and creamy sauces—contribute significantly to overall energy density. Understanding these mechanisms provides context for the compositional profiles presented throughout this resource.
Deep-fried dishes form a cornerstone of traditional pub menus. These preparations involve immersion in hot oil, which adds substantial amounts of fat and increases overall energy density compared to their theoretical unseasoned components.
| Dish | Per 100g (kcal) | Typical Portion (kcal) | Fat (g per 100g) | Protein (g per 100g) |
|---|---|---|---|---|
| Fish & Chips | 220 | 550-650 | 11.5 | 15.2 |
| Scampi & Chips | 210 | 520-600 | 10.8 | 14.5 |
| Onion Rings | 280 | 280-350 | 17.2 | 3.8 |
| Chicken Nuggets | 250 | 400-500 | 15.5 | 17.2 |
These figures are derived from UK food composition tables and represent typical pub portion sizes. The energy density reflects both the inherent composition of the primary ingredient and the addition of dietary fat through the frying process.
Pies and pastry-based meals represent another significant category within pub cuisine. The pastry exterior, typically made with wheat flour and fat, substantially elevates the overall energy content. Fillings consisting of meat, vegetables, and gravy-based sauces further contribute to the total composition.
| Dish | Per 100g (kcal) | Typical Portion (kcal) | Saturated Fat (g) | Sodium (mg) |
|---|---|---|---|---|
| Steak & Ale Pie | 180 | 450-550 | 7.2 | 520 |
| Chicken & Mushroom Pie | 160 | 400-500 | 5.8 | 480 |
| Cornish Pasty | 290 | 580-680 | 12.1 | 620 |
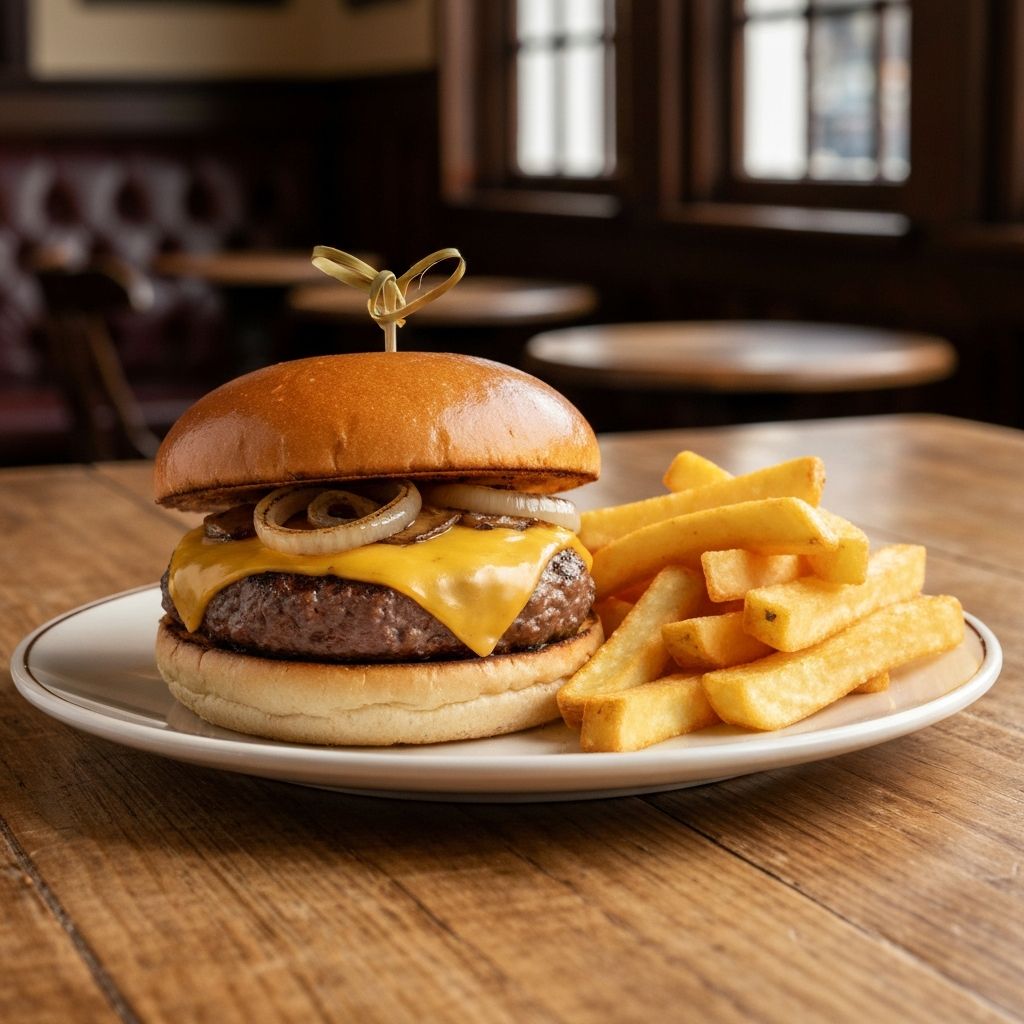
Grilled and fried burger offerings dominate many pub menus. These typically consist of ground or whole muscle meat, often served with fried accompaniments and various toppings.
| Dish | Per 100g (kcal) | Typical Portion (kcal) | Protein (g) | Fibre (g) |
|---|---|---|---|---|
| Beef Burger & Chips | 200 | 480-580 | 18.5 | 2.1 |
| Gammon & Eggs | 190 | 380-450 | 24.2 | 0 |
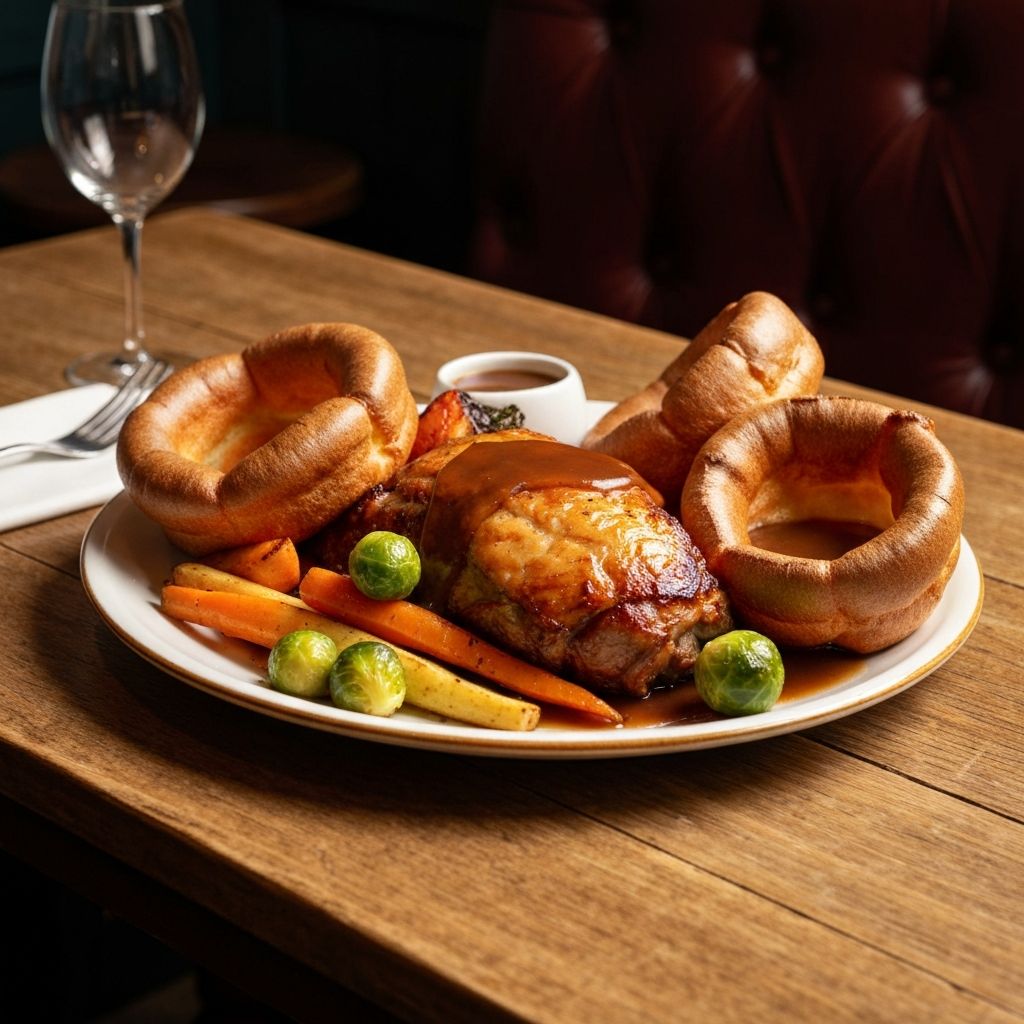
The Sunday roast represents a foundational element of British culinary tradition. When served in pub environments, it typically comprises roasted meat (beef, pork, or lamb), Yorkshire pudding, roasted vegetables, and gravy.
| Component | Per 100g (kcal) | Typical Serving (kcal) | Protein (g) | Fat (g) |
|---|---|---|---|---|
| Roast Beef (medium) | 180 | 225 | 26.5 | 9.8 |
| Yorkshire Pudding | 200 | 150-200 | 6.2 | 11.5 |
| Roasted Vegetables | 80 | 120-150 | 2.1 | 4.2 |
| Gravy (1 ladle) | 25 | 50-80 | 1.5 | 1.2 |
Many British pubs offer curry dishes as part of their menu. These preparations, originating from Indian culinary traditions, are typically prepared with cream-based sauces and coconut ingredients in pub contexts.
| Dish (with rice/naan) | Total Calories | Fat (g) | Carbohydrates (g) | Sodium (mg) |
|---|---|---|---|---|
| Chicken Tikka Masala | 650-750 | 28 | 52 | 1100 |
| Korma (milder) | 600-700 | 32 | 48 | 950 |
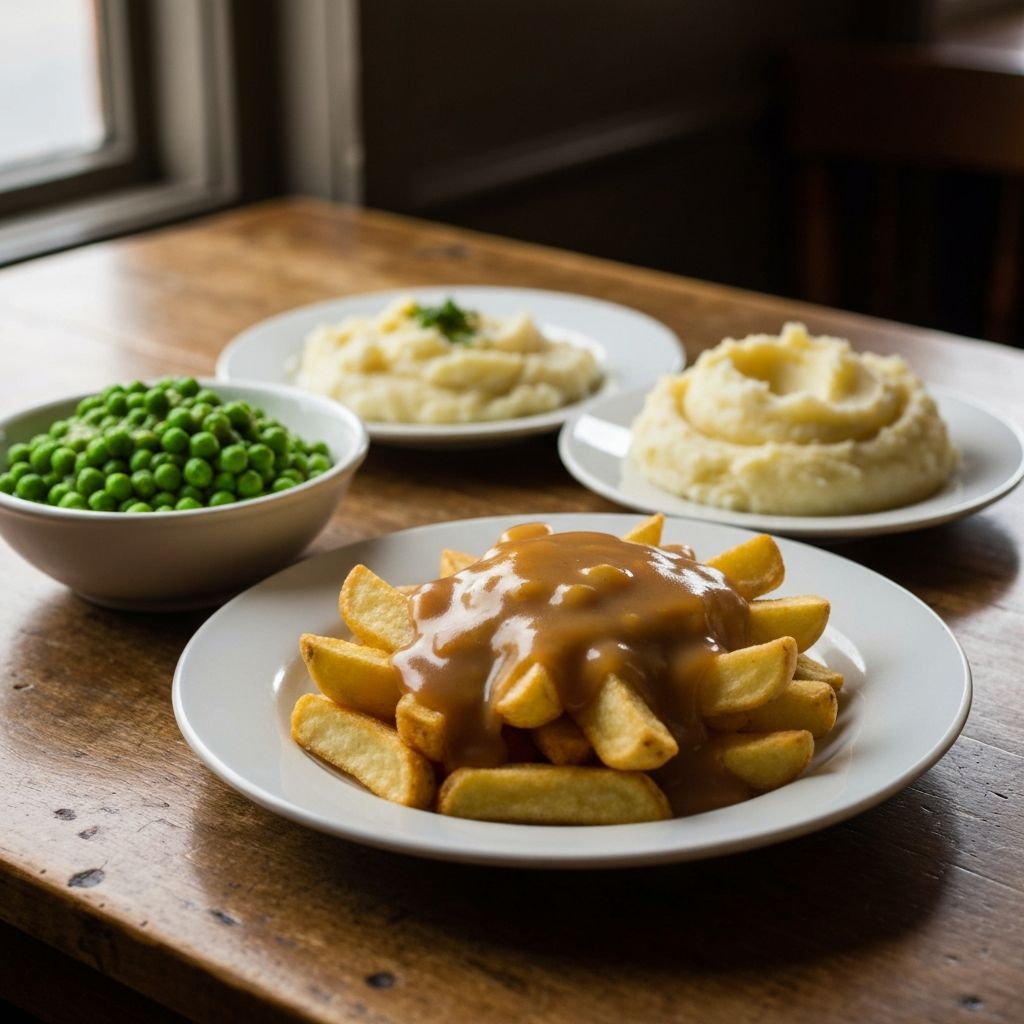
Side dishes significantly contribute to the overall energy content of a pub meal. Chips, mashed potato, and peas are standard accompaniments, each with distinct macronutrient profiles.
| Side Dish | Per 100g (kcal) | Typical Serving (kcal) | Main Macronutrient |
|---|---|---|---|
| Chips (deep-fried) | 265 | 265-330 | Fat: 15g |
| Mashed Potato | 100 | 150-200 | Carbs: 18g |
| Mushy Peas | 75 | 112-150 | Protein: 6g |
Pub desserts represent the concluding component of meals. Traditional options such as sticky toffee pudding, apple crumble, and cheesecake demonstrate varying energy densities and macronutrient compositions.
| Dessert | Per Serving (kcal) | Carbohydrates (g) | Fat (g) | Sugar (g) |
|---|---|---|---|---|
| Sticky Toffee Pudding | 380-420 | 52 | 18 | 38 |
| Apple Crumble | 320-360 | 45 | 14 | 28 |
| Cheesecake | 400-450 | 35 | 22 | 32 |
For comprehensive analysis of specific meal categories, explore our dedicated resource pages.
Energy density and macronutrient profile of the classic British deep-fried preparation.
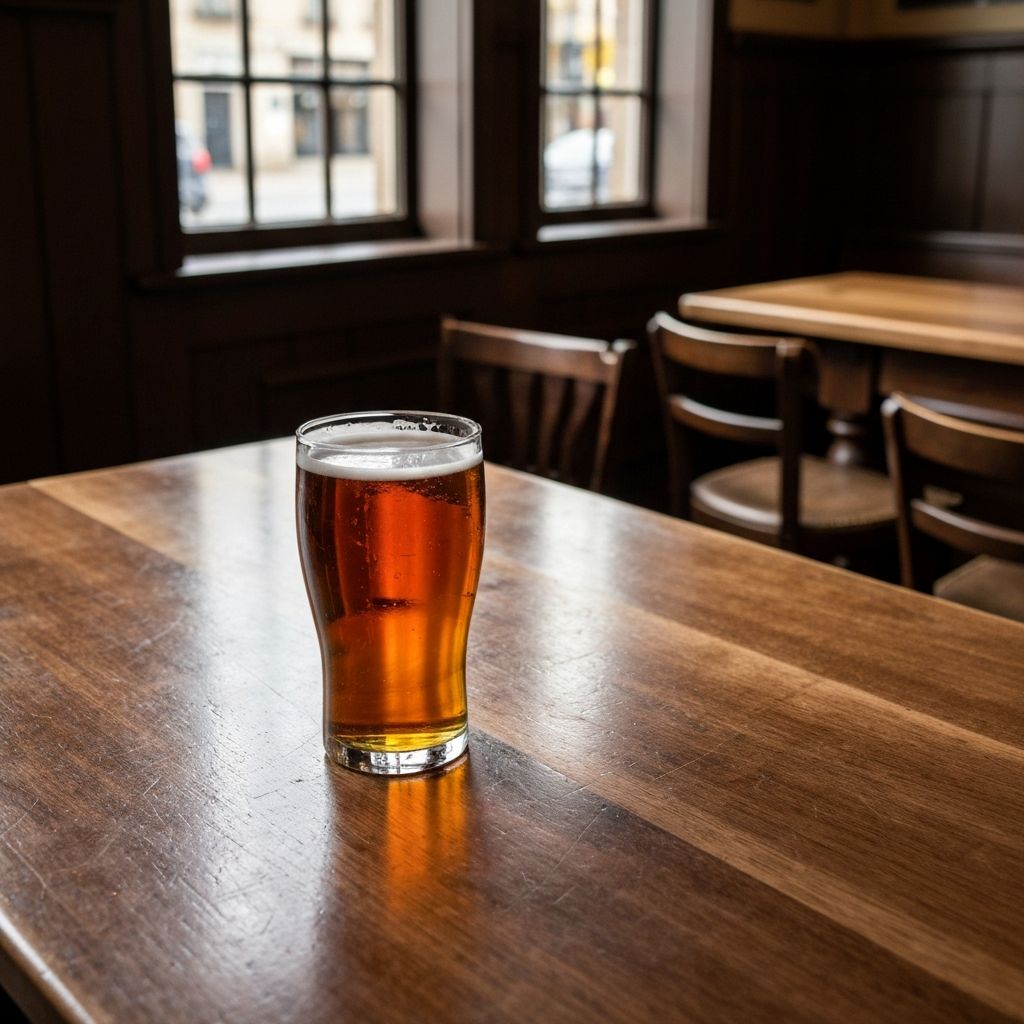
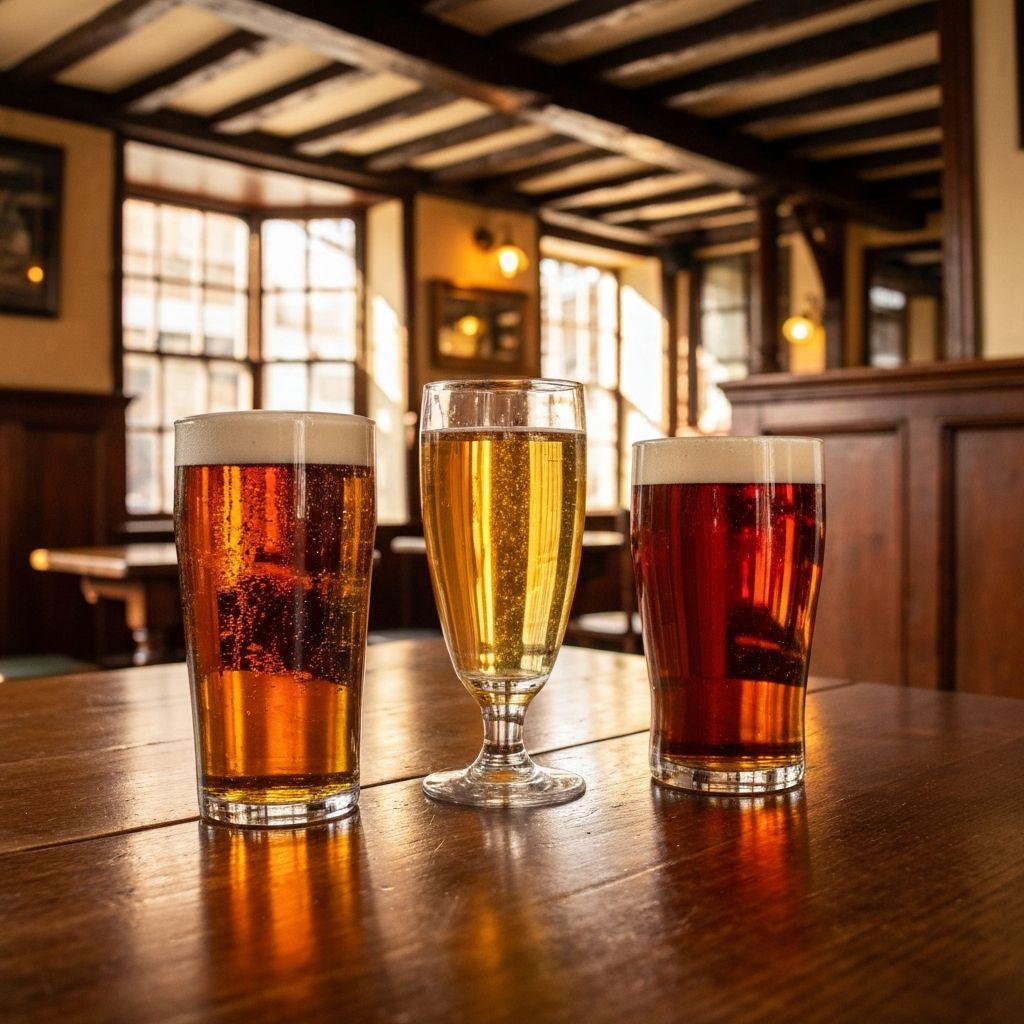
ExploreAlcoholic and non-alcoholic beverages commonly consumed in pub environments contribute substantially to total energy intake during a visit. The following table presents typical caloric content.
| Beverage | Per 100ml (kcal) | Typical Pint/Glass (kcal) | Alcohol Content (%) |
|---|---|---|---|
| Pint of Lager (4.2%) | 42 | 180 | 4.2 |
| Pint of Ale (4.5%) | 45 | 195 | 4.5 |
| Pint of Cider (4.5%) | 48 | 210 | 4.5 |
Alcoholic beverages contain 7 kilocalories per gram, compared to carbohydrates and protein at 4 kilocalories per gram. Consequently, the consumption of multiple drinks during a pub visit represents a substantial portion of total daily energy intake.
Energy density refers to the amount of kilocalories contained in a given weight of food, typically expressed as kcal per 100g. Foods high in water content possess lower energy density, whilst those rich in fat exhibit higher energy density.
Traditional pub preparation methods—particularly deep frying, the use of creamy sauces, and pastry-based preparations—result in high fat content. Fat contains more than twice the kilocalories per gram compared to carbohydrates or protein, thereby increasing overall energy density.
Portion size directly multiplies the energy density. A standard pub portion of chips (approximately 200-250g) contains substantially more energy than a smaller 100g serving, despite identical energy density per unit weight.
The values presented in this resource derive from UK food composition tables and represent typical pub preparations. Specific establishments may vary in portion sizes, preparation methods, and ingredient sourcing, resulting in differing nutritional profiles.
Pub portions vary considerably between establishments. The values presented here reflect common portion sizes encountered within the United Kingdom, typically ranging from 250g to 400g for main meals before accompaniments.
This resource presents factual nutritional data regarding traditional British pub meals. Explore the detailed composition of classic dishes.
Learn more about pub meal nutrition